Effect of Vitamin D Supplementation on Free and Total Vitamin D: A Comparison of Asians and Caucasians
Jaya Sujatha Gopal-Kothandapani (1); Lucy Faith Evans (2); Jennifer S. Walsh (2); Fatma Gossiel (2); Alan S. Rigby (3); Richard Eastell (2); Nick J. Bishop (1)
- Department of Oncology and Metabolism, University of Sheffield, Sheffield, UK.
- Academic Unit of Bone Metabolism, University of Sheffield, Sheffield, UK.
- Faculty of Health, Hull York Medical School, University of Hull, Hull, UK.
Clin Endocrinol. 2019;90(1):222-231.
Abstract
Objectives: It is well established that UK Asians typically have lower vitamin D levels than Caucasians. It is also known that vitamin D binding protein (DBP) is lower in some races than Caucasians. To investigate how ethnicity, skin colour and genetic variation affect the response to vitamin D (15000 IU) administered to young Asian and Caucasian men.
Design: Prospective, single-centre clinical trial.
Participants: Sixty young men (18–25 year) of Asian (n = 30) and Caucasian (n = 30) origin.
Measurements: We measured serum calcium, phosphate, magnesium, alkaline phosphatase, albumin, parathyroid hormone; total 25 hydroxyvitamin D (25OHD); calculated and directly measured free 25OHD; DBP at baseline and 4 weeks; DBP genotype, skin colour (Fitzpatrick scale), dietary vitamin D and calcium intake at baseline; and urine calcium:creatinine ratio at baseline, 1 and 4 weeks.
Results: At baseline, Asians had lower serum total 25OHD (26.4 [13.7] vs 34.1 [12.3] nmol/L P = 0.0272) and DBP (6.7 [3.4] vs 9.6 [4.4] nmol/L; P = 0.0065) but similar free 25OHD (16.7 [10.4] vs 17.8 [7.5] pmol/L P = 0.6530). After dosing, total 25OHD rose similarly in each group (≈56 nmol/L), but measured free 25OHD rose more in Asians (18.1 [9.4] vs 12.2 [13.3] pmol/L P = 0.0464). Lower DBP at baseline, possibly reflecting genotype differences, was associated with a greater change in measured free 25OHD in Caucasians, but not in Asians.
Conclusions: Asian compared with Caucasian males had a larger increment in measured free 25OHD following 150 000 units vitamin D3, possibly reflecting differences in DBP affinity for 25OHD. Ethnicity should be considered when devising guidelines for the treatment of vitamin D deficiency.
Introduction
Vitamin D deficiency is a term widely used but rarely defined in terms of functional outcomes. Based on synthesized evidence, thresholds for low-dose supplementation or higher dose treatment have been suggested. The Scientific Advisory Committee on Nutrition Department (SACN) recommends a threshold of 25 nmol/L for serum 25OHD for all individuals at any time of the year to protect the musculoskeletal health.[3] The Institute of Medicine defines the threshold for vitamin D deficiency as ≤30 nmol/L.[2]The Endocrine Society defines the threshold for vitamin D deficiency as <50 nmol/L, which would likely include more than half the population of the UK during winter months.[1]
What remains unclear is the extent to which “one size fits all” in providing vitamin D supplementation or treatment. In the UK, vitamin D deficiency is widely reported, more so in those with darker skin including those of African or Asian descent. The effect of ethnicity, independently of other factors, has not previously been considered when devising strategies and recommendations for either low-dose supplementation or higher dose treatment.
Vitamin D status is currently assessed by measuring circulating 25-hydroxyvitamin D (25OHD), which exists either free in the circulation (<1%), or bound to albumin or the vitamin D binding protein (DBP). The terms “free” vitamin D and “bioavailable” vitamin D refer, respectively, to unbound 25OHD, or unbound plus 25OHD bound to albumin. The extent to which the total measurement adequately reflects either free or bioavailable serum 25OHD and whether any relationship between “total” and “free” varies following supplementation, or with other factors such as ethnicity, is unclear. Reports of higher free and bioavailable serum 25OHD for the same total serum 25OHD in African Americans have been challenged because of concerns regarding DBP measurement accuracy.[4–8]
In the light of this, we sought to investigate whether there were differences between serum total and directly measured free 25OHD concentrations between Asians and White Caucasians and the changes in these parameters following administration of a single dose of 150 000 IU of vitamin D3. In addition, we aimed to determine the effect of covariates including DBP concentration and genotype, concurrent diet and skin colour on both the free and total 25OHD responses, and the extent of parathyroid hormone (PTH) suppression following dosing.
Materials and Methods
Study Design
This was an exploratory study to determine the size of the effect on serum free and total 25OHD of a 150 000 unit dose of vitamin D3, given to young adults from different ethnic groups (See Figure 1).
Study Participants
We recruited a cohort of sixty apparently healthy young adult men from two ethnic groups—White Caucasian (n = 30) or South-East Asian (n = 30) origin. Eligibility criteria included men aged between 18 and 25 years who were free from any condition affecting bone health, general nutrition, growth and glucose metabolism. Subjects with any chronic illness involving the liver and kidney, causing malabsorption, who used steroids, anticonvulsants, or vitamin D treatment as well supplementation or any medication that might affect calcium and vitamin D metabolism, were excluded. Recruitment took place within the University of Sheffield using a mixture of email, posters/leaflets and prelecture 2-minute talks. Subjects were students of the University of Sheffield, mostly medical and dental students. None of the study participants travelled to destinations where cutaneous vitamin D synthesis could have taken place during the study period. Whilst it was anticipated that gender should not impact on the outcome, the administration of a large dose of vitamin D3 might have had unexpected effects on an early-stage pregnancy, and thus, we excluded young women.
Demography and Auxology
At baseline, height (without shoes to next succeeding 1 mm by wall-mounted stadiometer [Holtain, Crymych]), weight (wearing vest and pants to nearest 0.1 kg by Marsden portable weighing scales, body mass index [BMI (kg/m2) and waist:hip circumference ratio (paper tape measure) were recorded in all subjects.
Dietary Calcium and Vitamin D Intake
A validated 101-item food frequency questionnaire (DIET-Q) was used to ascertain the dietary intake of calcium and vitamin D at baseline. Mean daily calcium (grams/d) and vitamin D (IU/d) intake were analysed using Q Builder (V4.0) nutritional software (Tinuviel software, Llanfechell, Anglesey UK).
Skin Type, Season and sun Exposure
Skin type was assessed using a 6-point Fitzpatrick scale in all subjects at baseline.[9] Fitzpatrick one skin type is fair and freckled; type six is very dark/black. The study was conducted in the UK during January and February to avoid sun exposure.
Samples
Baseline. Fasting blood samples were collected for serum total 25OHD, free 25OHD, calcium, phosphate, magnesium, albumin, alkaline phosphatase, PTH, DBP and DBP genotype.
Four weeks. All blood investigations (except DBP genotype) were repeated.
Urinary calcium: creatinine ratio. A fasting second void urine sample for calcium:creatinine ratio was collected at baseline, 1 and 4 weeks after vitamin D3 administration.
Vitamin D3 Dosing
A single dose of 150 000 IU of Vitamin D3 [6 mL of Invita D3 (Consiliant) 25 000 IU/mL oral solution] was administered under direct supervision. We chose this dose based on the work done by Oliveri B et al[10] where the authors demonstrated the safety of a single dose of 150 000 IU of vitamin D to maintain appropriate levels of 25OHD without causing hypercalcaemia or hypercalciuria.
Laboratory Methods
Serum total 25OHD. Serum total 25OHD levels were determined using an UPLC/Mass Spectrometer Semi-automated hexane extraction in the Acquity Ultra Performance LC/Quattro MS (Waters) analyser. Lower limit of detection for 25OHD2 was 6 nmol/L and for 25OHD3 3.5 nmol/L. The interassay coefficient of variation (CV) for 25OHD2 and 25OHD3 was 5.7% and 5.4%, respectively.
Serum free 25OHD. Free 25OHD levels were measured using an ELISA from Future Diagnostics Solutions. The interassay CV was 4.8%.
Serum vitamin D binding protein. D binding protein levels were measured using an ELISA from Genways Biotech Inc. The interassay CV was 5.8%.
Serum calcium, phosphate, albumin and alkaline phosphatase; urine calcium, creatinine. Measured using Micro Slide Technology Colorimetric/Rate by Reflectance Spectrophotometry in the Vitros 5, 1 FS System (Ortho Clinical Diagnostics) analyser. The interassay CVs were as follows: calcium (1.4%), phosphate (1.6%), albumin (2.9%), alkaline phosphatase (2.4%), urine calcium (1.7%) and urine creatinine (4.4%).
Intact Parathyroid hormone (PTH). Parathyroid hormone was measured using Immunoassay (Chemiluminescent Microparticle Immunoassay) in the Architect i 1000 System (Abbot) [PTH analytical sensitivity ≤1 ng/L].
DBP genotyping. A pyrosequencing assay was developed in house, using PSQ assay design software version 1.0.6 (Qiagen), to detect two single-nucleotide polymorphisms (SNPs), rs4588 and rs7041 in the DBP gene, that give rise to three common variants of DBP (a) Gc1f (b) Gc1s and (c) Gc2. All subjects were genotyped for six different haplotypes—Gc1f-1f, Gc1f-1s, Gc1f-2, Gc1s-1s, Gc1s-2 and Gc2-2, ranked here in order of 25OHD binding affinity, highest to lowest.
PCR and sequencing primers were as follows:
F: 5′-ATCTGAAATGGCTATTATTTTG-3′,
R: 5′ Btn-ACAGTAAAGAGGAGGTGAGTT-3′,
Seq: 5′-AAAAGCTAAATTGCCTG-3′.
To ensure distinct pyrosequencing signals, ~10 ng of human genomic DNA was amplified by 47 × PCR cycles using OneTaq® 2X Master Mix with Standard Buffer (NEB). For each genotype determination, single-stranded DNA was purified from 5 μL of PCR products using PyroMark Q96 Vacuum Prep Workstation (Qiagen). PCR products were denatured to single-stranded DNA (ssDNA) and annealed with sequencing primers. Pyrosequencing was then performed on a PyroMark Q96 MD Instrument according to manufacturer’s instructions (Qiagen). Nucleotide dispensation order was as follows: DBP rs4588 + rs7041 CATGTCACACACTG. SNP analysis was carried out using the SNP analysis software provided (Qiagen).
Calculated free and bioavailable 25OHD. Free and bioavailable 25OHD levels based on fixed affinity constant for the DBP genotype (Gc1f-1f) were calculated using the mathematical model described by Chun et al[11]
Sample Size
This was an exploratory study to determine effect size and variance; hence, no formal calculation of sample size was undertaken. We sought advice from the Yorkshire and Humber Research Design Service who suggested that a sample size of 30 per group was sufficient to undertake exploratory work of this nature.
Statistical Methods
Continuously distributed data were summarized by the median (25th/75th centiles), categorical data by n(%). Missing values are tabulated but not considered otherwise in our analysis.
Normality checks were carried out; data were generally normally or near-normally distributed, and hence, parametric tests were used to assess differences between groups.
To compare the groups prior to dosing, two sample t tests of baseline characteristics were performed and are reported in .
Table 1. Baseline demographics table, mean (SD)
| Whites | Asians | P value | |
| Study population | 30 | 30 | – |
| Age (y) | 21.43 (1.54) | 22.33 (1.44) | 0.66 |
| Weight (kg) | 76.97 (9.16) | 70.77 (8.34) | 0.34 |
| Height (cms) | 179.95 (5.59) | 175.77(5.6) | 0.95 |
| BMI | 23.76 (2.51) | 22.89 (2.30) | 0.61 |
| Waist : Hip ratio | 0.81 (0.05) | 0.88 (0.09) | 0.30 |
| Calcium intake (gms/d) | 1065.87 (266.88) | 1031.23 (382.6) | 0.28 |
| Vitamin D intake (iu/d)* | 120 (20, 524) | 140 (74,276) | 0.29 |
| Fitzpatrick skin grade | 1 – 3 | 3 – 5 | – |
| Serum calcium (mmol/L) | 2.31 (0.06) | 2.30 (0.05) | 0.49 |
| Serum phosphate (mmol/L) | 1.38 (0.19) | 1.36 (0.15) | 0.74 |
| Albumin (g/L) | 44.2 (2.2) | 43.7 (1.7) | 0.32 |
BMI, body mass index.
The main question of interest was whether ethnicity impacted on change in total and free 25OHD following dosing. Two sample ttests were carried out to compare the changes in total and free 25OHD between the groups. Analysis of variance was also used to determine any other statistical differences between the groups and adjust for covariates. Generalized linear models were used to determine statistical differences between response variables that had error distribution models other than normal, and to assess the interactive effect of ethnicity and DBP on change in free 25OHD.
Fisher’s exact test was used to compare the categorical data. Graphical presentation was made by Box and Whisker plot. Pvalues were used sparingly with an arbitrary threshold of 0.05 (two-tailed).
We performed all our analyses using Statistical Package for the Social Sciences version 22 (SPSS by IBM), Data Desk™ v6.2.1 and Stata v14.[12] For method comparison between directly measured serum free 25OHD and calculated free 25OHD, we used Medcalc for Windows, version 8.0 (Medcalc Software, Mariakerke, Belgium) to perform Bland-Altman analysis[13] and Passing-Bablok regression.[14]
Results
Baseline Clinical Characteristics
The baseline clinical characteristics of the study subjects are shown in . The White Caucasian and Asian men did not differ with respect to age, weight, height, BMI and waist to hip ratio. The mean (SD) calcium intake (grams/d) was adequate and equal between the Asians [1031.23(382.6)] and White Caucasians [1065.87(266.88)]. The median (range) vitamin D intake (IU/d) in comparison with the UK recommended daily intake was low and similar between the groups, 140(74 276) and 120(20 524) in Asians and White Caucasians, respectively. White Caucasians had a Fitzpatrick skin type of 1-3 and Asians 3-5. White Caucasians predominantly had Gc1s-2 haplotype and did not have Gc1f-1f and Gc1f-2. South Asians predominantly had Gc1s-1s haplotype and East Asians Gc1f-1f haplotype. Gc2-2 and Gc1s-2 were not found in East Asians (). shows the relationship between haplotype frequency and ethnicity. There was a significant association between the two (P = 0.052, Fisher’s exact test). There were more Asians with Gc1f-1f haplotype than expected [5 vs 2.5]. Similarly, more Caucasians with Gc2-1s haplotype than expected [11 vs.8.5].
Table 2. Haplotype frequencies by ethnicity and median 25OHD concentration at baseline
| Haplotype | Caucasian | Asian | Total | Haplotype | Caucasian | Asian |
| Median baseline 25OHD concentration (nmol/L) | ||||||
| Gc1f-1f | Obs 0 | 5 | 5 | Gc1f-1f | – | – |
| Exp 2.5 | 2.5 | |||||
| Gc1s-1f | Obs 9 | 6 | 15 | Gc1s-1f | 31.6 | 20.4 |
| Exp 7.5 | 7.5 | |||||
| Gc1s-1s | Obs 9 | 8 | 17 | Gc1s-1s | 40.8 | 20.4 |
| Exp 8.5 | 8.5 | |||||
| Gc2-1f | Obs 0 | 3 | 3 | Gc2-1f | – | – |
| Exp 1.5 | 1.5 | |||||
| Gc2-1s | Obs 11 | 6 | 17 | Gc2-1s | 33.2 | 24 |
| Exp 8.5 | 8.5 | |||||
| Gc2-2 | Obs 1 | 2 | 3 | Gc2-2 | 22.4 | 16.4 |
| Exp 1.5 | 1.5 | |||||
| Total | 30 | 30 | 60 | Fisher’s exact test, P = 0.052 | ||
shows the differences in baseline total 25OHD status between the different haplotypes and ethnicity. However, the numbers were too small for statistical comparison.
Influence of Ethnicity on Measured Parameters at Baseline and Following Intervention
Twenty-nine participants of the 60 recruited had a serum total 25OHD level of <30 mnmol/L at baseline, of which 60% (18/30) were Asian and 36% (11/30) were White Caucasian (). Asians had significantly lower serum total 25OHD and DBP levels, but similar measured and calculated free 25OHD levels compared to White Caucasians at baseline (). At 4 weeks, the changes in serum total 25OHD, DBP and calculated free 25OHD levels were similar between Asians and White Caucasians; however, the increase in directly measured serum free 25OHD level was significantly greater in Asians 18.1(9.4) vs 12.2 (13.3) pmol/L in Caucasians (P = 0.0464) () (Figure 2A, B and C). Although the observed significance was marginal, we considered it to be acceptable for a preliminary study.
Table 3. Results showing serum total and free 25OHD levels, estimated 25OHD and parathyroid hormone (PTH) levels at baseline and increment postsupplementation, mean and SD
| Serum total 25OHD (nmol/L) | Serum DBP(μmol/L) | Measured free 25OHD (pmol/L) | Calculated free 25OHD (pmol/L) | PTH (ng/L) | ||
| Baseline | Caucasians | 34.1 (12.3) | 6.6 (3.0) | 17.8 (7.5) | 13.6 (7.8) | 44.6 (14.2) |
| Asians | 26.3 (13.7) | 4.7 (2.3) | 16.7 (10.4) | 11.9 (6.8) | 69.8 (38.6) | |
| *P-value <0.05 | P value | 0.004* | 0.001* | 0.65 | 0.38 | 0.0019* |
| Increment | Caucasians | 56.7 (18.3) | 0.31 (2.0) | 12.2 (13.3) | 24.4 (14.5) | 2.2 (14.2) |
| Asians | 56.2 (12.6) | 0.24 (2.0) | 18.1 (9.4) | 29.4 (20.1) | – 4.7 (27.7) | |
| *P-value <0.05 | P value | 0.90 | 0.90 | 0.0464* | 0.29 | 0.24 |
DBP, D binding protein; PTH, parathyroid hormone.
*significant P-values.
A, B, C shows the change in total, free 25OHD and VDBP following vitamin D dosing. Three-part box plot showing ethnicity in x-axis and change in total 25OHD, VDBP and free 25OHD in y-axis. D, shows the change in serum free 25OHD according to mean D binding protein (DBP) with shaded circles representing Caucasians and clear circles for Asians [Colour figure can be viewed at wileyonlinelibrary.com]
There was a significant interaction (P = <0.01) between ethnicity and mean DBP in relation to change in free 25OHD following dosing. In Caucasians, a lower mean DBP was associated with a larger in an increase in measured free 25OHD; this was not true for Asians, in whom the relationship of free 25OHD with mean DBP was positive, that is as mean DBP increased, the change in free 25OHD also increased (Figure 2D).
We found no clear effect of DBP haplotype within the ethnic group on change in either total or free 25OHD, either alone or in combination with other factors.
Baseline PTH concentration was higher in Asians than in White Caucasians (P = 0.0019) (). Following intervention, no significant changes in PTH levels were noted in either of the groups (). No increase in urine calcium: creatinine ratio was noted at either 1 or 4 weeks postintervention.
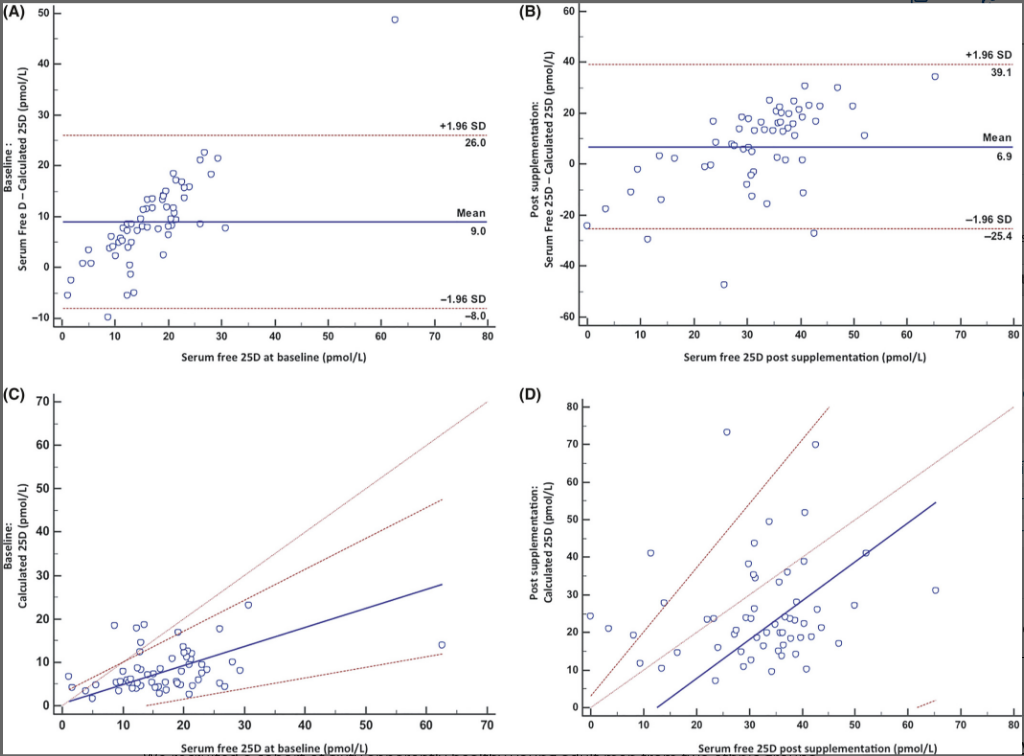
Bland-Altman plot at baseline shows clear evidence of bias and one outlying observation (Figure 3A). Passing-Bablok plot at baseline shows small and nonsignificant systematic bias (intercept = 0.54, 95% CI -3.54, 3.05 pmol/L). There is a significant proportional bias (slope = 0.43, 95% CI 0.24, 0.71 pmol/L) (Figure 3C).
A and B, shows the Bland-Altman plots. Bold line indicates mean difference with 95% limits of agreement on either side. A, demonstrates systematic bias between calculated (using fixed affinity constants) and directly measured serum free 25OHD at baseline and B, which is postsupplementation, does not. Mean serum free 25OHD (directly measured) is represented in x-axis, and the difference between the directly measured and calculated free 25OHD is represented on the y-axis. Bland-Altman plots the mean of X and Y vs the difference between X and Y. C and D, shows the Passing and Bablok plots. Bold line indicates the calculated regression. With 95% CI either side. The line of no difference is drawn at 45 degrees. C, demonstrates no systematic bias but a significant proportional bias at baseline. D, demonstrates neither systematic nor proportional bias postsupplementation. Serum free 25OHD (directly measured) is represented in x-axis and the calculated free 25OHD (using fixed affinity constants) represented on the y-axis. Passing and Bablok is a nonparametric regression for method comparison. It fits a straight line between two variables (X and Y) where both are measured with error. The intercept of the straight line represents the systematic bias between X and Y. The null hypothesis is zero intercept. If the 95% confidence (CI) crosses zero, the systematic bias is not statistically significant. The slope measures the amount of proportional bias. The null hypothesis is a slope of one. If the 95% CI cuts across on the proportional bias, it is not statistically significant. If the two methods are identical, then they will share a common intercept (zero) and a common slope (one) [Colour figure can be viewed at wileyonlinelibrary.com]
Method comparison between directly measured and calculated serum free 25OHD concentration using fixed affinity constant for the DBP genotype (Gc1f-1f)
Bland-Altman plot postsupplementation shows no evidence of bias (Figure 3B).
Passing-Bablok plot postsupplementation shows a large negative systematic bias (−13.29 pmol/L). This is not statistically significant (95% CI -33.82, 2.99 pmol/L). There is no significant proportional bias (slope = 1.04, 95% CI 0.54, 1.70 pmol/L) (Figure 3D).
Relationship of PTH With Total and Free 25OHD
There was a statistically significant negative correlation between PTH and total 25OHD at baseline (r = −0.442; P = 0.0006) and postintervention (r = −0.452; P = 0.0004). However, the relationship of PTH at baseline with measured free 25OHD did not reach significance at baseline (r = −0.245; P = 0.0634) or following intervention (r = −0.061; P = 0.6446).
Relationship of Skin Type With Total and Free 25OHD
There was no statistically significant difference between skin types and baseline total 25OHD concentrations by one-way ANOVA (F (4,54) = 2.08, P = 0.0956). Postdosing total 25OHD also did not differ between skin types.
Relationship of DBP Genotypes on Total and Free 25OHD
There were no significant differences by DBP genotype for baseline total 25OHD (F ratio = 1.0075, P = 0.4225) or serum free 25OHD (F ratio = 0.4838, P = 0.7868). Following intervention, subjects with Gc1f-1s haplotype (high affinity for 25OHD) showed the greatest increment in serum total 25OHD (increment 60.65 (17.3) nmol/L; baseline 32.9 (14.0) nmol/L). Subjects with the lowest affinity haplotype Gc2-2 had the smallest increment in serum total 25OHD (increment 48.9 (6.9) nmol/L, baseline 18.4 (3.6) nmol/L). The increment in serum direct free 25OHD levels was greatest in subjects with the Gc2-1s (16.6 (10.2) pmol/L; low-affinity haplotype), and lowest in subjects with Gc1f-1f (10.1 (11.9) pmol/L highest affinity haplotype). None of these differences reached statistical significance, however.
Relationship of Dietary Calcium and Vitamin D Intake With PTH, DBP, Total and Free 25OHD
There was no relationship of dietary calcium intake at baseline with baseline PTH, DBP, total or free 25OHD, or change in any of those parameters, either for the whole group or by ethnicity.


Discussion
We found that serum total 25OHD was low in young men of White Caucasian and Asian ethnic origin during winter in Sheffield and increased similarly in both groups following administration of 150 000 units of vitamin D3, but that measured free 25OHD increased more in those of Asian origin. We found a relationship between both baseline and mean DBP concentration and incremental change in measured free 25OHD according to ethnicity. As mean DBP rose, the incremental increase in free 25OHD reduced in Caucasians and increased in Asians. This suggests that the binding affinity of DBP may vary with ethnic origin.
There is a biochemical basis for the differences in affinity of the different DBPs for vitamin D metabolites. Polymorphisms in the Gc gene (codominant alleles) give rise to three major electrophoretic variants of Gc (Gc1f, Gc1s and Gc2), which differ by amino acid substitutions as well as glycosylation.[15] The amino acid sequence of the three isoforms 1f, 1s and 2 differ at positions 152, 311, 416 and 420.[16] The position 416 difference is functionally important as this site contains a branched trisaccharide that in turn is linked to sialic acid (1f), mannose (1s) or no sugar residue (2). Such post-translational modifications are likely to affect the properties of the isoforms. Indeed, the relative affinity constants differ, so that if 1f is assigned a value of one, then the values for 1s and 2 are 0.536 and 0.321, respectively.[11,4]
Calculated estimates of free 25OHD were found to be significantly different from direct measurements and showed a systematic bias. According to the free hormone hypothesis,[5] the biological action of 25OHD is exerted by its freely available form (<1% of the total), not by the total circulating amount which comprises DBP-bound (85%-90%) and albumin-bound (10%-15%) forms plus free. There is support also for the concept of bioavailable 25OHD,[17] comprising the albumin-bound and free fractions, suggesting that measurement of free or bioavailable 25OHD concentration may provide a more meaningful marker of vitamin D function than total.[6]
The movement of DBP-bound 25OHD to bioavailable or free forms likely depends in part on the concentration of DBP and its binding affinity for 25OHD. Both are known to vary significantly both by and within ethnic groups. A recent report by Yao et al has also demonstrated significantly lower levels of DBP (P < 0.001) measured using a monoclonal assay (165.3 ± 90.4 μg/mL) in comparison with the polyclonal assay (418.7 ± 99.0 μg/mL) in a Chinese population.[7] Powe et al[17] in their cross-sectional study reported that Black Americans have lower total 25OHD and DBP resulting in similar concentrations of calculated bioavailable 25OHD compared with white counterparts . Bouillon et al[8] showed similar results in Black Gambians compared with White Caucasians using the same DBP assay. In contrast, when they measured DBP using a polyclonal assay (as used here), in the same cohort, they did not find any difference between the groups . Similarly, Aloia et al[18] reported identical concentrations of DBP between US Black people and White people, using a polyclonal assay . Recently, Nielson et al[19]compared the DBP assays used in the MrOS and MRC cohorts[20] and characterized the molecular forms of DBP.[21] The authors reported that the difference in DBP levels between the Africans and White people identified using a monoclonal assay disappeared when measured using polyclonal or proteomic methods.[21] This contrasts with our results; we found a significant difference in DBP levels between the Asians and White Caucasians using the polyclonal assay. Lower DBP levels have previously been documented in carriers of two Gc2 alleles.[22–24] We found no clear effect of genotype either at baseline or following intervention on serum DBP, irrespective of ethnicity. As our population size is small, the results in relation to DBP and genotype should be considered preliminary and thus need confirming in a larger population.
We found directly measured serum free 25OHD at baseline in Asians and Caucasians to be very similar despite lower total 25OHD in Asians. We hypothesized originally that the lower DBP concentrations found in the Asians in our cohort were likely to be the reason for their comparable levels of free 25OHD. Following intervention with vitamin D3, no change in DBP levels was observed in either Asians or White Caucasians when compared to baseline, indicating that the serum DBP concentration is not altered by single-dose supplementation. Our findings agree with those of with Sollid, where no effect of vitamin D3 on serum DBP concentration was shown in an interventional trial (20 000 IU D3 weekly for a year) in Caucasians.[24]
We found a higher increment in measured free 25OHD concentration in Asians following vitamin D3 supplementation, despite a similar increment in total 25OHD concentration and no significant change in DBP concentration. In addition, the incremental increase in Caucasians’ serum free 25OHD was inversely related to both baseline and mean DBP, whereas in Asians, it was not. This implies that DBP affinity for vitamin D and its metabolites may be a key factor in the response of Asians to vitamin D treatment. The lack of a clear relationship with DBP genotype could imply that additional factors may be at play, or may be due to the small sample size.
Alzaman et al[25] compared the differences in total and free 25OHD levels between Black and White Americans following daily D3 supplementation (2000 IU or 4000 IU) or placebo for a total of sixteen weeks in nearly 200 diabetic subjects. The authors found similar and dose-proportionate increases in both total and free 25OHD in both groups. Sollid et al studied the relationships between serum total and free 25OHD (both directly and by calculation) in relation to age, sex, BMI, season and DBP genotype and their inter-relationship with the weekly administration of 20 000 units of D3/placebo for a year in nearly 500 individuals. The authors found that serum DBP was not affected by vitamin D supplementation. They demonstrated that age, sex and DBP concentration did not affect increment in vitamin D parameters, following supplementation.[24]
If serum free 25OHD increases disproportionately in some ethnic groups following vitamin D administration, is this a problem? There is another step beyond 25-hydroxylation in producing the biologically active form of vitamin D (1,25(OH)2D), and this step is highly regulated to protect against hypercalcaemia. The finding here that PTH did not decrease as expected in White Caucasians as both free and total serum 25OHD increased is puzzling. However, PTH did decrease in the Asian group; this suggests that the greater increase in free 25OHD in Asians may have broader biological significance in terms of calcium metabolism, perhaps reflecting increased calcium absorption. Asians had lower baseline total serum 25OHD and are more likely (as a population group) to receive treatment. The concern would be therefore that significantly increasing calcium absorption might have unexpected and undesirable consequences in an ethnic group already at higher risk for cardiovascular and renal disease.
In the method comparison between the calculated and directly measured serum free 25OHD using fixed affinity constant for the DBP genotype, there was a positive but not significant systematic bias at baseline. Postsupplementation, the systematic bias was negative and also nonsignificant. We cannot explain this finding. This may be due to small sample size (Figure 3A,B,C and D).
Strengths & Limitations
Ours is the first interventional study reported so far, studying the effects of single dose of vitamin D3 on serum total 25OHD, DBP and free 25OHD concentration in both Asians and Caucasians. The main limitation of our study is the small sample size; hence, we had an insufficient statistical power to demonstrate the influence of skin types or DBP genotypes on serum 25OHD (total and free) with or without vitamin D3 supplementation. We conducted the study exclusively in young healthy males; hence, our study findings may not be applicable to conditions associated with variation in DBP levels such as gender, pregnancy, liver disease and infections, and may not necessarily be applicable across all ages. We also included no functional outcome measures.
Conclusion
Our primary aim was to determine the size of the effect of vitamin D supplementation in different ethnic groups. In an era of “precision medicine,” we should be able to better target vitamin D treatment. Rather than adopting a “one size fits all” policy, we should aim to develop measurements that accurately reflect vitamin D status across all ethnic groups, and use these to guide treatment for relevant functional outcomes.
References
- SACN vitamin D and health report – GOV.UK. Govuk. 2017. https://www.gov.uk/government/publications/sacn-vitamin-d-and-health-report. Accessed July 25, 2018.
- Ross AC, Manson JE, Abrams SA, et al. The 2011 report on dietary reference intakes for calcium and vitamin D from the Institute of Medicine: what clinicians need to know. J Clin Endocrinol Metab. 2011;96(1):53–58.
- Home | Endocrine Society. Endocrineorg. 2017. http://www.endocrine.org. Accessed July 25, 2018.
- Arnaud J, Constans J. Affinity differences for vitamin D metabolites associated with the genetic isoforms of the human serum carrier protein (DBP). Hum Genet. 1993;92(2):183–188.
- Mendel C. The free hormone hypothesis: a physiologically based mathematical model*. Endocr Rev. 1989;10(3):232–274.
- Chun R, Peercy B, Orwoll E, Nielson C, Adams J, Hewison M. Vitamin D and DBP: the free hormone hypothesis revisited. J Steroid Biochem Mol Biol. 2014;144:132–137.
- Yao P, Sun L, Lu L, et al. Effects of genetic and non-genetic factors on total and bioavailable 25(OH)D responses to vitamin D supplementation. J Clin Endocrinol Metab. 2017;102:100–110. jc.2016–2930. https://doi.org/10.1210/jc.2016–2930.
- Bouillon R, Jones K, Schoenmakers I. Vitamin D-binding protein and vitamin D in blacks and whites. N Engl J Med. 2014;370(9):878–881.
- Fitzpatrick T. The validity and practicality of sun-reactive skin types I through VI. Arch Dermatol. 1988;124(6):869–871.
- Oliveri B, Cassinelli H, Mautalen C, Ayala M. Vitamin D prophylaxis in children with a single dose of 150000 IU of vitamin D. Eur J Clin Nutr. 1996;50(12):807–810.
- Chun RF, Peercy BE, Adams JS, Hewison M. Vitamin D binding protein and monocyte response to 25-hydroxyvitamin D and 1,25-dihydroxyvitamin D: analysis by mathematical modeling. PLoS One. 2012;7(1):e30773.
- StataCorp 2017. Stata Statistical Software Release 15. College Station, TX. StataCorp LLC.
- Martin Bland J, Altman D. Statistical methods for assessing agreement between two methods of clinical measurement. Lancet. 1986;327(8476):307–310.
- Passing H, Bablok W. A new biometrical procedure for testing the equality of measurements from two different analytical methods. Application of linear regression procedures for method comparison studies in clinical chemistry, part I. Clin Chem Lab Med. 1983;21(11):709–720.
- Lauridsen AL, Vestergaard P, Nexo E. Mean serum concentration of vitamin D-binding protein (Gc globulin) is related to the Gc phenotype in women. Clin Chem. 2001;47(4):753–756.
- Nagasawa H, Uto Y, Sasaki H, et al. Gc protein (vitamin D-binding protein): Gc genotyping and GcMAF precursor activity. Anticancer Res. 2005;25(6A):3689–3695.
- Powe C, Ricciardi C, Berg A, et al. Erratum: vitamin D-binding protein modifies the vitamin D-bone mineral density relationship. J Bone Miner Res. 2012;27(6):1438.
- Aloia J, Mikhail M, Dhaliwal R, et al. Free 25(OH)D and the vitamin D paradox in African Americans. J Clin Endocrinol Metab. 2015;100(9):3356–3363.
- Orwoll E, Blank J, Barrett-Connor E, et al. Design and baseline characteristics of the osteoporotic fractures in men (MrOS) study — A large observational study of the determinants of fracture in older men. Contemp Clin Trials. 2005;26(5):569–585.
- Jones K, Assar S, Harnpanich D, et al. 25(OH)D2 half-life is shorter than 25(OH)d3half-life and Is influenced by DBP concentration and genotype. J Clin Endocrinol Metab. 2014;99(9):3373–3381.
- Nielson C, Jones K, Chun R, et al. Free 25-Hydroxyvitamin D: impact of vitamin D binding protein assays on racial-genotypic associations. J Clin Endocrinol Metab. 2016;101(5):2226–2234.
- Bikle D, Bouillon R, Thadhani R, et al. Vitamin D metabolites in captivity? Should we measure free or total 25(OH)D to assess vitamin D status? J Steroid Biochem Mol Biol. 2017;173:105–116.
- Bouillon R. Genetic and racial differences in the vitamin D endocrine system. Endocrinol Metab Clin North Am. 2017;46(4):1119–1135.
- Sollid S, Hutchinson M, Berg V, et al. Effects of vitamin D binding protein phenotypes and vitamin D supplementation on serum total 25(OH)D and directly measured free 25(OH)D. Eur J Endocrinol. 2016;174(4):445–452.
- Alzaman N, Dawson-Hughes B, Nelson J, DAlessio D, Pittas A. Vitamin D status of black and white Americans and changes in vitamin D metabolites after varied doses of vitamin D supplementation. Am J Clin Nutr. 2016;104(1):205–214.
Acknowledgements
We thank study volunteers for their participation and acknowledge support by the staff at the Sheffield Children’s Hospital Clinical Research Facility. We thank Antonio Milano (Department of Genetics, Sheffield Children’s hospital) for genotyping Vitamin D Binding Protein; Emilia Bettell, Sharon Colyer (Department of Clinical Biochemistry, Sheffield Children’s hospital) and Tim Thorpe (Department of Clinical Biochemistry, Bristol Royal Infirmary) for undertaking biochemical assays. We sincerely thank Rene F Chun (University of California) and Martin Hewison (Molecular Endocrinology, University of Birmingham), for their support towards the calculation of the serum free and bioavailable 25OHD.
Funding information
Sir Halley Stewart Trust, Grant/Award Number: n/a