Changes in the Human Metabolome Associated With Alcohol Use
A REVIEW
Taija Voutilainen; Olli Kärkkäinen
Alcohol Alcohol. 2019;54(3):225234
Abstract AND INTRODUCTION
Aims: The metabolome refers to the functional status of the cell, organ or the whole body. Metabolomic methods measure the metabolome (metabolite profile) which can be used to examine disease progression and treatment responses. Here, our aim was to review metabolomics studies examining effects of alcohol use in humans.
Methods: We performed a literature search using PubMed and Web of Science for reports on changes in the human metabolite profile associated with alcohol use; we found a total of 23 articles published before end of 2018.
Results: Most studies had investigated plasma, serum or urine samples; only four studies had examined other sample types (liver, faeces and bronchoalveolar lavage fluid). Levels of 51 metabolites were altered in two or more of the reviewed studies. Alcohol use was associated with changes in the levels of lipids and amino acids. In general, levels of fatty acids, phosphatidylcholine diacyls and steroid metabolites tended to increase, whereas those of phosphatidylcholine acylalkyls and hydroxysphingomyelins declined. Common alterations in circulatory levels of amino acids included decreased levels of glutamine, and increased levels of tyrosine and alanine.
Conclusions: More studies, especially with a longitudinal study design, or using more varied sample materials (e.g. organs or saliva), are needed to clarify alcohol induced diseases and alterations at a target organ level. Hopefully, this will lead to the discovery of new treatments, improved recognition of individuals at high risk and identification of those subjects who would benefit most from certain treatments.
Introduction
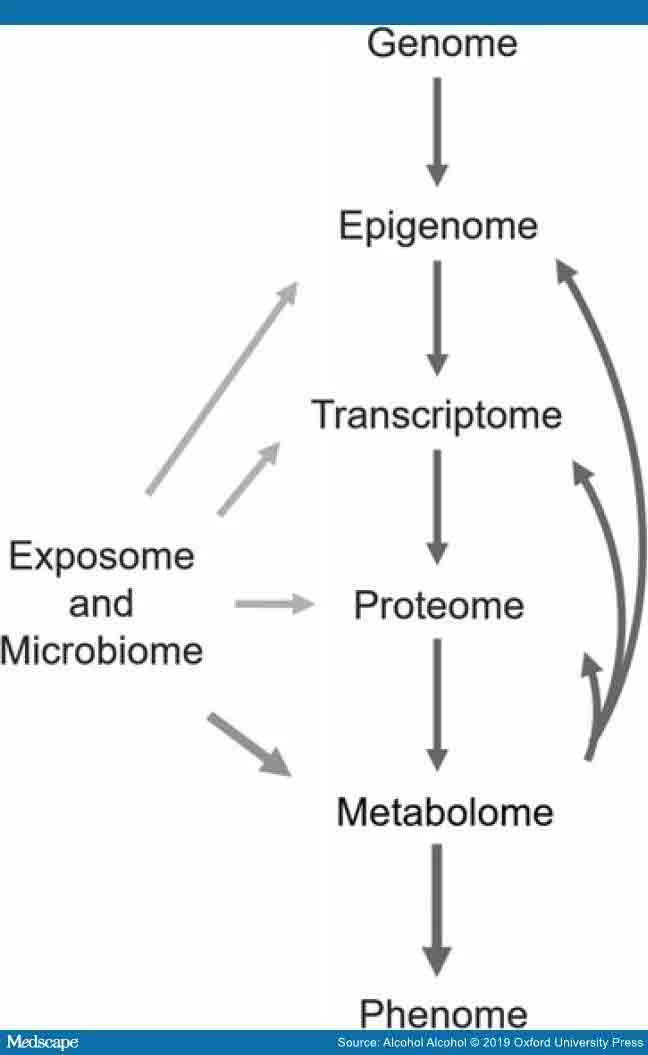
Metabolomics (metabonomics, metabolic profiling) is an omics approach that makes it possible to study the metabolome, i.e. metabolic changes in the body by measuring small molecules (metabolites) (Bujak et al., 2015). Unlike the genome and proteome, the metabolome directly represents the functional changes in cellular metabolism (See – Figure 1). Thus, it provides a view about the current physiological state of the sample. In the human circulation and organs, there are also metabolites produced by microorganisms and metabolites originating directly from nutrition or other exogenous sources. Metabolomics has been widely utilized in investigating both physiological conditions and pathological states (Bujak et al., 2015). Consequently, metabolomics can also be used in biomarker research not only to identify early predictive markers and novel targets for therapies, but also to monitor disease progression and treatment outcomes. Furthermore, many metabolites have shown some potential to be used to modify phenotype, for example, to prevent organ damage or disease progression. (Guijas et al., 2018).
Metabolomic centric view of different omics methods. Flow of information from genotype to phenotype is shown. Metabolomics is aiming to measure the metabolome, i.e. all of the small molecules (metabolites) produced by endogenous processes in a sample. Metabolomics methods also measure metabolites from different exposures, like nutrition or alcohol consumption, as well as the metabolites produced by microbiota. With respect to the omics, metabolomics focuses on functional changes and is closest to the phenotype. Metabolites can also affect epigenetic modulation, gene expression, and protein function (as can exogenous and microbiota produced compounds). The metabolome can be used to follow disease progression or responses to treatment, because it is altered by changes in endogenous processes and exogenous exposures.
The basic methods used in metabolomics research are nuclear magnetic resonance (NMR) and mass spectrometry (MS) coupled with either liquid or gas chromatography (LC or GC, respectively) (Ulaszewska et al., 2019). MS based methods are usually more sensitive than NMR based methods. In other words, MS can usually detect more metabolites than NMR. For example, from serum samples, NMRbased methods can measure tens to hundreds of compounds, whereas MSbased techniques are able to measure hundreds to thousands of metabolites. However, some important molecules, like lipoproteins, can be measured with NMR, but not with MS metabolomic methods. Therefore, the combination of both NMR and MS methods provides the widest possible coverage of different metabolites. Although the chromatographic and MS techniques are highly versatile, enabling measurement of different types of compounds, these approaches are subject to challenges in terms of reproducibility and variability between labs. NMR has lower costs per sample and is better suited for screening large numbers of samples. Furthermore, NMR metabolomic methods are usually quantitative. In contrast, MSbased methods can be either (a) untargeted and semiquantitative (where the goal is to measure as many as possible metabolites) or (b) targeted and quantitative (where certain selected groups of metabolites are measured against standards). For a more detailed description and hints for study design see Ulaszewska et al. (2019).
Alcohol use disorder is a global health problem accounting for substantial losses for both individuals and societies (Griswold et al., 2018). The biochemical processes underpinning the adverse health effects are not yet fully understood. In this respect, metabolomics represents a novel approach to increasing our understanding of alcohol related problems. Metabolomic methods enable followup of disease progression or an evaluation of how some treatment has affected the metabolome (Bujak et al., 2015). This increased understanding of pathology could lead to the discovery of possible new targets for therapies to prevent or mitigate alcohol caused health problems.
In addition, metabolomics could help in the search for identifying a biomarker profile or pattern; this could be used not only to predict disease progression or the response to medication (Nam et al., 2015; Hinton et al., 2017), but possibly also to quantify alcohol use. Unfortunately, many currently used biomarkers for alcohol use lack specificity and sensitivity. For example, the biomarkers measuring liver enzymes provide information only about the functionality of the liver but not the cause of damage. Another biomarker, the percentage of carbohydrate deficient transferrin (%CDT), can be elevated due to severe liver disease or due to pregnancy (Gough et al., 2015; Bortolotti et al., 2018). Recently, phosphatidylethanols have been introduced as selective biomarkers for alcohol use, but they need to be measured from samples not collected routinely (whole blood or tissues) because phosphatidylethanols are an integral part of cell membranes (Zheng et al., 2011). Clearly, there is a need to devise biomarkers which would indicate the quantity of alcohol use, and that these could be measured routinely from serum or plasma. This is especially true with sensitive populations like pregnant women.
The aim of this review was to examine and compare the current publications about how alcohol use influences metabolome in humans. Furthermore, we will highlight some future directions for this field.
Methods
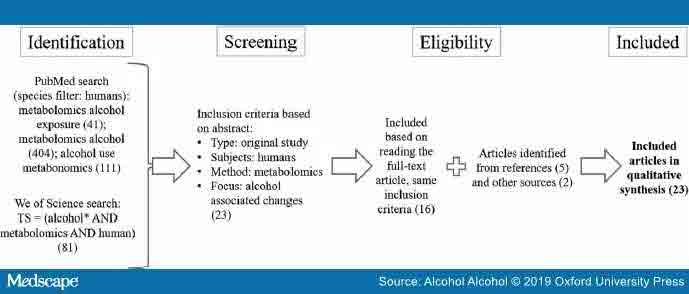
We searched PubMed for articles published online before the end of 2018 with the terms metabolomics alcohol (404), metabolomics alcohol exposure (41) and alcohol use metabonomics (111) using ‘Humans’ criteria in the species filter (See – Figure 2). After the search, we evaluated the abstracts of the articles. Inclusion criteria for acceptance to further reading were metabolomic studies in humans and changes in metabolite levels based on alcohol consumption/exposure to alcohol as well as English language of the report. We did additional search using Web of Science with search terms TS = (alcohol* AND metabolomics AND human) AND LANGUAGE: (English) AND DOCUMENT TYPES: (Article), Timespan: 1975–2018, Indexes: SCI-EXPANDED and found one new reference. Furthermore, wealso scanned the references of the included articles for other papers and found five new relevant references, which were included in this review. Further two studies were identified by communication with other researchers. From the analysed articles, we collected information about the used sample material, cohort size, age and sex of the subjects, used methods for metabolomics analysis and assessment of alcohol use, and direction of the change from significantly altered metabolites.
Schematic illustration of the article searches and the inclusion criteria. The number of articles in each phase is shown in parentheses. These searches were restricted to include only studies in humans.
Because the nomenclature of metabolites varied between studies, we utilized The Human Metabolome Database (http://www.hmdb.ca/), PubChem database (https://pubchem.ncbi.nlm.nih.gov/) and/or Chemical Entities of Biological Interest (ChEBI, https://www.ebi.ac.uk/chebi/) to identify and classify the same metabolites.


Results
Based on our literature search and inclusion criteria, we found 23 articles that were subjected to a thorough evaluation (). In these studies, serum had been the most commonly used material sampled (11 studies), followed by urine (6 studies) and plasma (five studies). In three of the studies, either plasma or serum had been used depending on the subjects. Only four studies had examined specimens other than plasma or serum, i.e. faeces, liver and bronchoalveolar lavage fluid. Of the 23 studies, 17 had used MSbased methods to detect metabolites while 6 had utilized NMR. In eleven studies, MS was coupled with LC to separate the metabolites before measurement.
TABLE 1 – Metabolomics research in humans evaluating changes in metabolite profiles associated with alcohol consumption

Abbreviations: AD, alcohol dependence; ARIC, the Atherosclerosis Risk in Communities; ARLD, alcoholrelated liver damage; AUD, alcohol use disorder; AUDIT, The Alcohol Use Disorder Identification Test; BALF, bronchoalveolar lavage fluid; CARLA, Cardiovascular disease, Living and Ageing in Halle; CVD, cardiovascular disease; EPIC, The European Prospective Investigation into Cancer and Nutrition; FFQ, food frequency questionnaire; FIAESI, flow injection analysis coupled with electrospray ionization; NASH, nonalcoholic steatohepatitis; NIH, National Institutes of Health; MECHE, Metabolic Challenge Study; PLCO, Prostate, Lung, Colorectal, Ovarian; SMAST, Short Michigan Alcohol Screening Test; TCE, Tinospora cordifolia aqueous extract; VOC, volatile organic compounds.
The size of the study population in these studies was highly variable—from mere tens to nearly 10,000. Twelve studies had study populations of <100 individuals, five had study populations between 100 and 1000 subjects, and in six studies more than 1000 subjectshad been examined. Mostafa et al. (2016, 2017) used the same study population in both studies, while Pallister et al., 2016; Jaremek et al., 2013 both evaluated subjects from the Twins UK cohort. The other publications used either individual study population or cohorts.
The determination of alcohol consumption had been most often (in 14 studies) determined by different questionnaires or self reporting. Four of the studies were nutritional interventions, where the alcohol consumption was classified according to the types of alcohol beverages consumed. In five studies, the way in which alcohol consumption had been determined was not specified.
The aims and objectives of the studies were variable (). While in some studies the aim had been to study alcohol induced metabolic changes in general (Würtz et al., 2016; van Roekel et al., 2018) or in order to link these changes to certain risk factors (Zheng et al., 2014; Lacruz et al., 2016), in others, the aim had been to find biomarkers for alcohol use (Guertin et al., 2014; O’Gorman et al., 2014; Harada et al., 2016) or aid in the diagnosis of alcohol dependence (Mostafa et al., 2017). Some studies had more specific aims such as trying to discriminate histologically similar liver pathologies using a metabolomics approach (Lian et al., 2011; Schofield et al., 2017).
TABLE 1 – Metabolomics research in humans evaluating changes in metabolite profiles associated with alcohol consumption
Abbreviations: AD, alcohol dependence; ARIC, the Atherosclerosis Risk in Communities; ARLD, alcoholrelated liver damage; AUD, alcohol use disorder; AUDIT, The Alcohol Use Disorder Identification Test; BALF, bronchoalveolar lavage fluid; CARLA, Cardiovascular disease, Living and Ageing in Halle; CVD, cardiovascular disease; EPIC, The European Prospective Investigation into Cancer and Nutrition; FFQ, food frequency questionnaire; FIAESI, flow injection analysis coupled with electrospray ionization; NASH, nonalcoholic steatohepatitis; NIH, National Institutes of Health; MECHE, Metabolic Challenge Study; PLCO, Prostate, Lung, Colorectal, Ovarian; SMAST, Short Michigan Alcohol Screening Test; TCE, Tinospora cordifolia aqueous extract; VOC, volatile organic compounds.
It is common that there are disparities between the results emerging from metabolomics studies due to differences in methodology, study design and population. Nonetheless, we were interested to see if the 23 reviewed articles had similar findings and therefore we compared the metabolites they had identified. The metabolites detected in two or more studies are compiled in . We counted a total of 51 such metabolites, most of which were either lipids or amino acids.
TABLE 2 – Alcohol use related changes in metabolite levels observed in at least two different studies

Abbreviations: LysoPC a, lysophosphatidylcholine; PC ae, phosphatidylcholine acylalkyls; PC aa, phosphatidylcholine diacyl; SM(OH), hydroxysphingomyelins.
aChange observed in males only.
Discussion
The purpose of this review was to summarize the current knowledge about the metabolomics of human alcohol use to highlight what has been examined already and consider what could be future directions. We identified 23 studies that had utilized a metabolomics approach for measuring changes in metabolite profiles in relation to alcohol use. The metabolite profile changes observed in the reviewed articles were consistent: alcohol consumption caused changes mostly in lipids and weak organic acids, many of which were involved in energy metabolism ( and Figure 3). From , it is not possible to state that any combination of these metabolites would be suitable as a biomarker for alcohol consumption, for that more research is needed.
TABLE 2 – Alcohol use related changes in metabolite levels observed in at least two different studies
Abbreviations: LysoPC a, lysophosphatidylcholine; PC ae, phosphatidylcholine acylalkyls; PC aa, phosphatidylcholine diacyl; SM(OH), hydroxysphingomyelins.
aChange observed in males only.
Metabolites associated with the energy metabolism. Metabolites, which were associated with significant changes after alcohol consumption, in at least two studies are shown in dark tone. Metabolite alterations reported in only one study are shown in light tone. If contrary findings were reported between different sample types (e.g. serum and faeces) then the direction of change in circulating metabolite levels are shown in the figure (See – Figure 3). Nicotinamide adenine dinucleotide is a cofactor needed for many of the enzymatic reactions seen in the figure (See – Figure 3), including reactions in the Kreb’s cycle and the metabolism of alcohol (ethanol). Abbreviations: LysoPC a, lysophosphatidylcholine; PC ae, Phosphatidylcholine acylalkyls; PC aa, phosphatidylcholine diacyl; SM, hydroxysphingomyelins.
Lipids are major building blocks and signalling molecules in the body. Here, alcohol use was associated with increased circulatory levels of fatty acyls (fatty acids and phosphatidylcholine diacyls) and steroid metabolites, and decreased levels of phosphatidylcholine acylalkyls and hydroxysphingomyelins. Similar findings have been reported in liver of different species exposed to alcohol, and changes in lipid metabolism are considered to be crucial factors in the pathogenesis of alcohol induced steatosis (Clugston et al., 2017). Furthermore, increased fatty acid concentrations contribute to the hepatocellular damage induced by chenodeoxyglycocholic acid (Pusl et al., 2008), a bile acid metabolite associated with liver cirrhosis (Lian et al., 2011). Moreover, increased levels of Lacetylcarnitine (a cofactor needed to transfer fatty acids inside mitochondria for energy metabolism) and pipecolate have also been associated with chronic liver disease (Kawasaki et al., 1988; Lian et al., 2011). Thus, the changes in the lipid profile attributable to alcohol use are likely to be associated, at least partly, with pathological changes in liver function. Furthermore, alcohol consumption is associated with alterations in the steroid metabolism, in line with increased circulating levels of steroid metabolites () (Guertin et al., 2014; Zheng et al., 2014; Pallister et al., 2016; Kumari et al., 2016). Hormonal imbalances contribute to altered function of many organs, as well as increasing an individual’s susceptibility to infections and cancer (Zheng et al., 2014; Bereshchenko et al., 2018).
TABLE 2 – Alcohol use related changes in metabolite levels observed in at least two different studies
Abbreviations: LysoPC a, lysophosphatidylcholine; PC ae, phosphatidylcholine acylalkyls; PC aa, phosphatidylcholine diacyl; SM(OH), hydroxysphingomyelins.
aChange observed in males only.
In addition to lipids, several of the weak organic acids associated with alcohol use are important for energy metabolism (Figure 3). The levels of glucose, alanine and lactate were commonly found to be increased while those of glutamine and asparagine declined. In addition, in one of the reviewed studies, serum levels of malate (Zheng et al., 2014), glutamate (Lehikoinen et al., 2018), and pyruvate (Würtz et al., 2016) were increased in relation to alcohol use. Citrate levels were reported to be decreased in serum (Würtz et al., 2016) but increased in urine (Mostafa et al., 2016). Thus, it can be concluded that alcohol consumption is associated with changes in energy metabolism. For example, in the brain, glucose is the main energy supply that provides acetylCoA for Kreb’s cycle, but heavy alcohol use seems to promote the uptake of acetate to be used as an alternative energy source (Jiang et al., 2013). Imbalances in cellular energy metabolism lead to the generation of reactive oxygen species and the formation of toxic intermediates, both of which are stressors of cellular function and viability.
Although only few studies have investigated the role of microbiota in alcohol use disorder, it seems that alcohol use increases gut permeability and induces changes in the composition of microbial flora causing dysbiosis (Barve et al., 2017; Leclercq et al., 2017; Temko et al., 2017). This dysbiosis possibly influences the absorption and transfer of metabolites. For instance, the altered levels of LysoPC C17:0 and indole3lactic acid might be due to changes in gut flora (Jaremek et al., 2013; Roager and Licht, 2018). Moreover, the increased lactic acid levels in urine associated with alcohol use could be secondary to dysbiosis since lactic acid is a bacterial metabolite that has been claimed to modulate immune responses (Morita et al., 2019). Alcohol induced dysbiosis might also be related to increased bile acid synthesis, perhaps reflected in the increased serum chenodeoxyglycocholic acid levels (Lian et al., 2011; Ridlon et al., 2015). Furthermore, alcohol use was associated with alterations in the faecal metabolome, e.g. decreased levels of amino acids like glutamine and serine, likely reflecting alterations in the microbiome () (Bajaj et al., 2017).
TABLE 2 – Alcohol use related changes in metabolite levels observed in at least two different studies
Abbreviations: LysoPC a, lysophosphatidylcholine; PC ae, phosphatidylcholine acylalkyls; PC aa, phosphatidylcholine diacyl; SM(OH), hydroxysphingomyelins.
aChange observed in males only.
In addition, there are some metabolites that might directly be related to drinks and food, e.g. cyclo(leupro) dipeptide is present in beers (Gautschi et al., 1997; Guertin et al., 2014; Zheng et al., 2014), and piperine is found in black pepper (Meghwal and Goswami, 2013; Zheng et al., 2014; Pallister et al., 2016).
Changes in the kinetics of the metabolites, might also affect the detected levels. In there are some metabolites (e.g. citrate, Lacetylcarnitine, chenodeoxyglycocholic acid and indole3lactic acid), whose levels were increased in one study but decreased in one other. In most cases, the sample type being examined was different, which indicates that kinetics could explain the opposing results in different sample types, e.g. while the metabolite level may decrease in the urine or faeces, this may lead to its increase in the blood and vice versa. It should also be noted that not all metabolites related to alcohol use have linear associations, but instead seem to display Ushaped dose response curves (Würtz et al., 2016).
TABLE 2 – Alcohol use related changes in metabolite levels observed in at least two different studies
Abbreviations: LysoPC a, lysophosphatidylcholine; PC ae, phosphatidylcholine acylalkyls; PC aa, phosphatidylcholine diacyl; SM(OH), hydroxysphingomyelins.
aChange observed in males only.

LIMITATIONS & FUTURE PERSPECTIVES
First, most of the studies reviewed were cross-sectional, only a few were either randomized crossover or longitudinal studies. Therefore, there is a need for longitudinal studies which could provide valuable information about disease processes at different stages and find biomarkers for predicting the health outcomes (e.g. cirrhosis or mortality), or treatment responses. For example, increased glutamate levels have been claimed to predict a response to acamprosate treatment in patients with alcohol use disorder (Nam et al., 2015; Hinton et al., 2017). However, the lack of a placebo control group in both studies limits the conclusions that can be made.
Secondly, the examined sample sizes varied extensively: most had <100 individuals, five had 100–1000, and six studies had study populations of more than 1000 individuals. Large studies are generally required in metabolomics if one wishes to observe small and medium size changes. However, due to the lack of robust methods, power calculations are not frequently performed in metabolomics studies and required sample size has varied greatly depending, for example, in study design, subject selection and how large effect sizes are considered to be biologically important (Blaise et al., 2016).
Thirdly, the sample type in most of the reviewed articles was either serum, plasma or urine. Only four studies had some other sample type: bronchoalveolar lavage fluid (Obianyo et al., 2015), faecal (Couch et al., 2015; Bajaj et al., 2017) and liver samples (Schofield et al., 2017). Future studies should increase the variety of samples used, and to have several sample types from same individual if possible. For example, saliva is a noninvasive and readily available material representing both local and systemic health status and could be useful in evaluating alcohol use related health outcomes, especially for mouth and upper throat cancers (Bujak et al., 2015; Mikkonen et al., 2016). In addition, metabolomics studies investigating organ samples can provide knowledge about pathological processes or endstages, for example in the liver, pancreas, heart and brain. Although outside the scope of this review, animal models are crucial in analysing disease progression in organs, which can only be analysed from postmortem samples in humans, for example the brain (Meinhardt et al., 2015; Kashem et al., 2016).
Fourthly, the measurement and evaluation of alcohol consumption and subsequent classification to low, moderateor high consumption groups varied between the studies although most simply used different types of questionnaires. Another way to improve a comparison of metabolite profiles in metabolomics studies would be to use currently available alcohol biomarkers, especially phosphatidylethanols, as well as recording which different alcoholic beverage types were consumed (VázquezFresno et al., 2012; Gürdeniz et al., 2016; QuiferRada et al., 2017). Moreover, more metabolomic studies on acute alcohol exposure are warranted, since we found only one report of the changes associated with acute alcohol consumption (Irwin et al., 2018).
Lastly, the selection of the control group is challenging in alcohol research. In some of the studies reviewed, the control group was younger and there were more females than males (Obianyo et al., 2015; Mostafa et al., 2016, 2017). In contrast, several studies had only male subjects or very few females (). Differences between sexes have been reported (e.g. increased levels of branched chain amino acids in males) and therefore balance between males and females could influence results of metabolomics studies (Audono et al., 2018; Heikkinen et al., 2019). Moreover, individuals with a high alcohol intake tend to have a poorer nutritional status, which will affect both the metabolite profile and the severity of the adverse metabolic effects related to alcohol use (Barve et al., 2017). Furthermore, tobacco smoking is a common confounding factor since it is more common in alcohol users than in healthy controls (Harrison et al., 2008) and it changes the metabolome, e.g. reduction of levels of several glycerophospholipids (Hsu et al., 2017). Future studies are needed with more females and improved selection of control group(s) to control for confounding effects and to increase generalizability of the results.
TABLE 1 – Metabolomics research in humans evaluating changes in metabolite profiles associated with alcohol consumption

Abbreviations: AD, alcohol dependence; ARIC, the Atherosclerosis Risk in Communities; ARLD, alcohol related liver damage; AUD, alcohol use disorder; AUDIT, The Alcohol Use Disorder Identification Test; BALF, bronchoalveolar lavage fluid; CARLA, Cardiovascular disease, Living and Ageing in Halle; CVD, cardiovascular disease; EPIC, The European Prospective Investigation into Cancer and Nutrition; FFQ, food frequency questionnaire; FIAESI, flow injection analysis coupled with electrospray ionization; NASH, nonalcoholic steatohepatitis; NIH, National Institutes of Health; MECHE, Metabolic Challenge Study; PLCO, Prostate, Lung, Colorectal, Ovarian; SMAST, Short Michigan Alcohol Screening Test; TCE, Tinospora cordifolia aqueous extract; VOC, volatile organic compounds.
In conclusion, the metabolomics research conducted so far clearly shows that alcohol use is associated with changes in the levels of circulating metabolites, especially lipids and amino acids. On a more critical note, metabolomic studies have not yet revolutionized our understanding of alcohol induced pathology or provided us with novel biomarkers. More studies with longitudinal study designs, and experiments using different sample types (preferably collected from the same individuals) are needed. In addition, combining metabolomics with measurements of the microbiota, proteomics and transcriptomics, could provide a more holistic view enhancing our understanding of how alcohol use is associated with pathological processes.
References
1. Audono M, Maldini M, De Fabiani E, et al. (2018) Genderrelated metabolomics and lipidomics: from experimental animal models to clinical evidence. J Proteomics 178:82–91.
2. Bajaj J, Kakiyama G, Zhao D, et al. (2017) Continued alcohol misuse in human cirrhosis is associated with an impaired gutliver axis. Alcohol Clin Exp Res 41:1857–65.
3. Barve S, Chen SY, Kirpich I, et al. (2017) Development, prevention, and treatment of alcoholinduced organ injury: the role of nutrition. Alcohol Res 38:289–302.
4. Bereshchenko O, Bruscoli S, Riccardi C. (2018) Glucocorticoids, sex hormones, and immunity. Front Immunol 9:1332.
5. Blaise BJ, Correia G, Tin A, et al. (2016) Power analysis and sample size determination in metabolic phenotyping. Anal Chem 88:5179–88.
6. Bortolotti F, Sorio D, Bertaso A, et al. (2018) Analytical and diagnostic aspects of carbohydrate deficient transferrin (CDT): a critical review over years 2007–2017. J Pharm Biomed Anal 147:2–12.
7. Bujak R, StruckLewicka W, Markuszewski MJ, et al. (2015) Metabolomics for laboratory diagnostics. J Pharm Biomed Anal 113:108–20.
8. Clugston R, Gao M, Blaner W. (2017) The hepatic lipidome: a gateway to understanding the pathogenes is of alcoholinduced fatty liver. Curr Mol Pharmacol 10:195–206.
9. Couch R, Dailey A, Zaidi F, et al. (2015) Alcohol induced alterations to the human fecal VOC metabolome. PLoS One 10:e0119362.
10. Gautschi M, Schmid JP, Peppard TL, et al. (1997) Chemical characterization of diketopiperazines in beer. J Agric Food Chem 45:3183–9.
11. Gough G, Heathers L, Puckett D, et al. (2015) The utility of commonly used laboratory tests to screen for excessive alcohol use in clinical practice. Alcohol Clin Exp Res 39:1493–1500.
12. Griswold M, Fullman N, Hawley C, et al. (2018) Alcohol use and burden for 195 countries and territories, 1990–2016: a systematic analysis for the Global Burden of Disease Study 2016. Lancet 392:1015–35.
13. Guertin K, Moore S, Sampson J, et al. (2014) Metabolomics in nutritional epidemiology: identifying metabolites associated with diet and quantifying their potential to uncover diet disease relations in populations. Am J Clin Nutr 100:208–17.
14. Guijas C, MontenegroBurke J, Warth B, et al. (2018) Metabolomics activity screening for identifying metabolites that modulate phenotype. Nat Biotechnol 36:316–20.
15. Gürdeniz G, Jensen MG, Meier S, et al. (2016) Detecting beer intake by unique metabolite patterns. J Proteome Res 15:4544–56.
16. Harada S, Takebayashi T, Kurihara A, et al. (2016) Metabolomic profiling reveals novel biomarkers of alcohol intake and alcohol induced liver injury in community dwelling men. Environ Health Prev Med 21:18–26.
17. Harrison E, Desai R, McKee S. (2008) Nondaily smoking and alcohol use, hazardous drinking, and alcohol diagnoses among young adults: findings from the NESARC. Alcohol Clin Exp Res 32:2081–7.
18. Heikkinen N, Kärkkäinen O, Laukkanen E, et al. (2019) Changes in the serum metabolite profile correlate with decreased brain gray matter volume in moderate to heavy drinking young adults. Alcohol 75:89–97.
19. Hinton D, Vázquez M, Geske J, et al. (2017) Metabolomics biomarkers to predict acamprosate treatment response in alcohol dependent subjects. Sci Rep 7:2496.
20. Hsu P, Lan R, Brasky T, et al. (2017) Metabolomic profiles of current cigarette smokers. Mol Carcinog 56:594–606.
21. Irwin C, van Reenen M, Mason S, et al. (2018) The 1 HNMRbased metabolite profile of acute alcohol consumption: a metabolomics intervention study. PLoS One 13:e0196850.
22. Jaremek M, Yu Z, Mangino M, et al. (2013) Alcohol induced metabolomic differences in humans. Transl Psychiatry 3:e276.
23. Jiang L, Gulanski B, De Feyter H, et al. (2013) Increased brain uptake and oxidation of acetate in heavy drinkers. J Clin Invest 123:1605–14.
24. Kashem M, Ahmed S, Sultana N, et al. (2016) Metabolomics of neurotransmitters and related metabolites in postmortem tissue from the dorsal and ventral striatum of alcoholic human brain. Neurochem Res 41:385–97.
25. Kawasaki H, Hori T, Nakajima M, et al. (1988) Plasma levels of pipecolic acid in patients with chronic liver disease. Hepatology 8:286–9.
26. Kumari S, Mittal A, Dabur R. (2016) Moderate alcohol consumption in chronic form enhances the synthesis of cholesterol and C21 steroid hormones, while treatment with Tinospora cordifolia modulate these events in men. Steroids 114:68–77.
27. Lacruz M, Kluttig A, Tiller D, et al. (2016) Cardiovascular risk factors associated with blood metabolite concentrations and their alterations during a 4year period in a population based cohort. Circ Cardiovasc Genet 9:487–94.
28. Leclercq S, de Timary P, Delzenne N, et al. (2017) The link between inflammation, bugs, the intestine and the brain in alcohol dependence. Transl Psychiatry 7:e1048.
29. Lehikoinen A, Kärkkäinen O, Lehtonen M, et al. (2018) Alcohol and substance use are associated with altered metabolome in the first trimester serum samples of pregnant mothers. Eur J Obstet Gynecol Reprod Biol 223:79–84.
30. Lian J, Liu W, Hao S, et al. (2011) A serum metabonomic study on the difference between alcoholand HBVinduced liver cirrhosis by ultraperformance liquid chromatography coupled to mass spectrometry plus quadrupole timeofflight mass spectrometry. Chin Med J 124:1367–73.
31. Meghwal M, Goswami T. (2013) Piper nigrum and Piperine: an update. Phytother Res 27:1121–30.
32. Meinhardt M, Sévin D, Klee M, et al. (2015) The neurometabolic fingerprint of excessive alcohol drinking. Neuropsychopharmacology 40:1259–68.
33. Mikkonen J, Singh S, Herrala M, et al. (2016) Salivary metabolomics in the diagnosis of oral cancer and periodontal diseases. J Periodontal Res 51:431–7.
34. Mittal A, Dabur R. (2015) Detection of new human metabolic urinary markers in chronic alcoholism and their reversal by aqueous extract of Tinospora cordifolia Stem. Alcohol Alcohol 50:271–81.
35. Morita N, Umemoto E, Fujita S, et al. (2019) GPR31dependent dendrite protrusion of intestinal CX3CR1+ cells by bacterial metabolites. Nature 10.1038/s4158601908841.
36. Mostafa H, Amin A, Teh C, et al. (2016) Metabolic phenotyping of urine for discriminating alcohol dependent from social drinkers and alcoholnaïve subjects. Drug Alcohol Depend 169:80–4.
37. Mostafa H, Amin A, Teh C, et al. (2017) Plasma metabolic biomarkers for discriminating individuals with alcohol use disorders from social drinkers and alcoholnaive subjects. J Subst Abuse Treat 77:1–5.
38. Nam H, Karpyak V, Hinton D, et al. (2015) Elevated baseline serum glutamate as a pharmacometabolomic biomarker for acamprosate treatment outcome in alcoholdependent subjects. Transl Psychiatry 5:e621.
39. Obianyo O, Liang Y, Burnham E, et al. (2015) Metabolic consequences of chronic alcohol abuse in nonsmokers: a pilot study. PLoS One 10:e0129570.
40. O’Gorman A, Morris C, Ryan M, et al. (2014) Habitual dietary intake impacts on the lipidomic profile. J Chromatogr B 966:140–6.
41. Pallister T, Jennings A, Mohney R, et al. (2016) Characterizing blood metabolomics profiles associated with self reported food intakes in female twins. PLoS One 11:e0158568.
42. Pusl T, Wild N, Vennegeerts T, et al. (2008) Free fatty acids sensitize hepatocytes to bile acidinduced
apoptosis. Biochem Biophys Res Commun 371:441–5.
43. QuiferRada P, ChivaBlanch G, Jáuregui O, et al. (2017) A discovery driven approach to elucidate urinary metabolome changes after a regular and moderate consumption of beer and nonalcoholic beer in subjects at high cardiovascular risk. Mol Nutr Food Res 61:1600980.
44. Ridlon J, Kang D, Hylemon P, et al. (2015) Gut microbiota, cirrhosis, and alcohol regulate bile acid metabolism in the gut. Dig Dis 33:338–45.
45. Roager H, Licht T. (2018) Microbial tryptophan catabolites in health and disease. Nat Commun 9:3294.
46. Schofield Z, Reed M, Newsome P, et al. (2017) Changes in human hepatic metabolism in steatosis and cirrhosis. World J Gastroenterol 23:2685–95.
47. Temko J, Bouhlal S, Farokhnia M, et al. (2017) The microbiota, the gut and the brain in eating and alcohol use disorders: a ‘Ménage à Trois’? Alcohol Alcohol 52:403–13.
48. Ulaszewska M, Winert C, Trimiqno A, et al. (2019) Nutrimetabolomics: an integrative action for metabolomic analyses in human nutritional studies. Mol Nutr Food Res 63:e1800384.
49. van Roekel E, Trijsburg L, Assi N, et al. (2018) Circulating metabolites associated with alcohol intake in the European prospective investigation into cancer and nutrition cohort. Nutrients 10:E654.
50. VázquezFresno R, Llorach R, Alcaro F, et al. (2012) 1 HNMRbased metabolomic analysis of the effect of moderate wine consumption on subjects with cardiovascular risk factors. Electrophoresis 33:2345–54.
51. Würtz P, Cook S, Wang Q, et al. (2016) Metabolic profiling of alcohol consumption in 9778 young adults. Int J Epidemiol 45:1493–1506.
52. Zheng Y, Beck O, Helander A. (2011) Method development for routine liquid chromatography–mass spectrometry measurement of the alcohol biomarker phosphatidylethanol (PEth) in blood. Clin Chim Acta 412:1428–35.
53. Zheng Y, Yu B, Alexander D, et al. (2014) Metabolomic patterns and alcohol
Acknowledgements
We wish to thank Dr E wen MacDonald for proof reading the English language. This work was supported by the Finnish Foundation for Alcohol Studies (O.K.) and the Orion Research Foundation (T.V.). Part of the subject of this review was presented in a plenary lecture of the European Society for Biomedical Research on Alcoholism (ESBRA) Nordmann Award Meeting, LouvainlaNeuve, Belgium on 12 October 2018. The speaker was Dr Olli Kärkkäinen as a recipient of the 2018 Nordmann Award.
Alcohol Alcohol. 2019;54(3):225234. © 2019 Oxford University Press
Copyright 2007 Medical Council on Alcohol. Published by Oxford Univ ersity Press. All rights reserved.